Selected Student Research
|
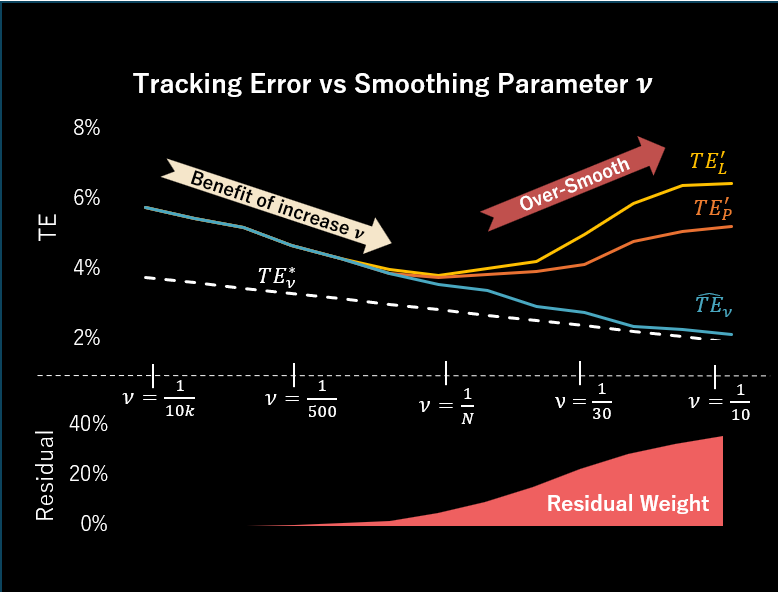
Minimizing Tracking Error with Cardinality Constraints: An Application of Smoothing Indicator FunctionPortfolio managers who attempt to minimize tracking errors often encounter the cardinality constraint, which limits the number of assets in a portfolio to a specified integer. Achieving the global minimum tracking error portfolio under this constraint is challenging due to the discontinuity it introduces. This constraint renders the search difficult in the minimization process because most search algorithms are not suitable to handle the discontinuity. An alternative approach involves transforming the cardinality constraint into a continuous form using a smoothing indicator function. The function mitigates the constraint’s discontinuity by allowing itself to take on fractional values, thereby aiding the optimizer in solving the minimization problem. The degree of smoothness of this function significantly affects the tracking error outcome, the smoother the function, the lower the tracking error. However, excessive smoothing may permit the optimizer to employ assets beyond the limit, indicating that over-smooth is not always practical. This study investigates the impact of the smoothing indicator function, focusing on identifying the appropriate level of smoothness that balances acceptable tracking error without utilizing assets beyond the limit. The analysis includes several index types and examines two different smoothing functions to provide comprehensive insights.
|
|
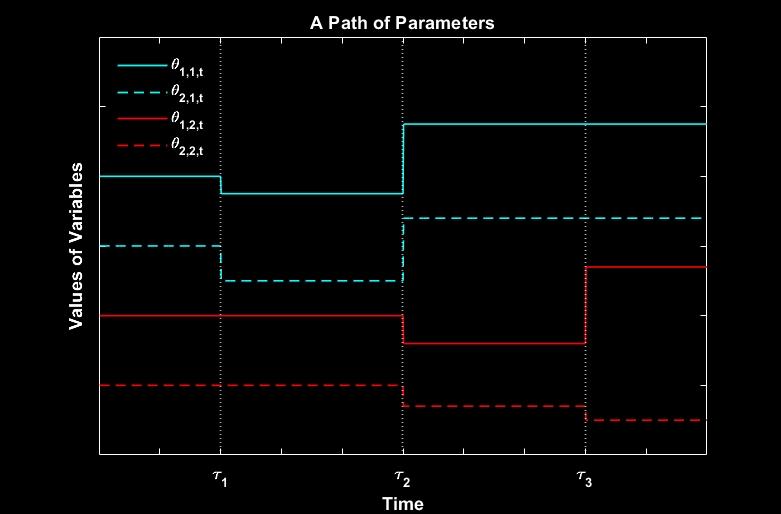
A Panel Partial Break Model for Forecasting Stock Returns with Parameter InstabilityPredicting stock returns is one of the most fascinating problems in finance. However, predicting stock returns is also one of the most challenging problems due to the instability and noisy nature of stock returns. One of the promising directions to handle both problems is to use a panel break model. Recently, a panel common break model has been proposed and shown to generate superior predictive performance. However, the model assumes that every parameter breaks simultaneously, which is not aligned with empirical data. In this article, we propose a novel panel break model that addresses the main limitation of the common break model while still retaining its main advantage by allowing each type of parameter to break separately. Moreover, our model allows correlated breaks between each parameter type through a common hidden time-varying break probability. We evaluated its performance on the top 100 largest US stocks from January 2002 to December 2021. The results show that our model provides improved performance when stocks experience a series of extreme returns, as our model is quite sensitive to data. On the one hand, this can be helpful for faster detection of high-impact breaks during crises. On the other hand, it can result in too many false detections. Further restricting the model, using more data, and fine-tuning the hyperparameters may improve the model’s performance.
|

|
Allocating the Tracking Error for the Multi-Asset-Class Fund by Reconciling Bottom-Up Model with Top-Down ModelIn the management of benchmarked funds, managers can incur tracking errors (TEs) in the attempt to create alphas. Our work focuses on a multi-asset-class fund that is constrained not only by a limit on the portfolio's TE, but also by the limits on the asset classes' TEs. We are interested in finding the optimal TE utilized by each asset class, so that the portfolio achieves the maximum expected alpha without violating the TE limits. (The optimal TEs are depicted as the blue dots in the graph.) This problem, if mis-specified, can lead to a mis-allocation of TEs to the asset classes. (The green dot, which is far away from the blue dots, shows a mis-allocation of TEs.) We find that the key for a successful reconciliation is to approximate the correlation structure of each pair of asset classes by an affine function (shown as the grey plane). Our method proves successful in determining a more optimal use of TEs by asset classes. (The outcome of our method is shown as the pink dots, which are much nearer to the blue dots.)
|

|
The Hybrid Pareto Distribution, Implied Risk-Neutral Density and Option PricingThis study develops a new European option pricing model based on the Extreme Value Theory (EVT). In particular, we propose to use Hybrid Pareto (HP) distribution to model loss distribution under the risk-neutral probability measure, and derive closed-form pricing formulas for call and put options. Using the S&P 500 index data, we compare the goodness of fit of our model and a benchmark model in which losses are assumed to follow the Generalized Extreme Value (GEV) model proposed by Markose and Alenton (2011). The results show that our proposed HP model can improve the fit over the GEV model for at-the-money options with 30 days to expiration.
|

|
Optimal Entry, Exit and Stop-Loss Levels for Pairs Trading Strategies with an Application to Technology Hardware, Storage & Peripherals SectorIn this study, we develop a pairs trading strategy with optimal entry, exit, and stop-loss levels. The strategy involves selecting pairs of stocks and selecting optimal levels for entering and exiting the trade. We apply the cointegration method to find the combination of stocks and then model them with the Ornstein–Uhlenbeck process to find the probability and expected time to reach exit or stop-loss level. With a transaction cost and a cost of holding short position, we derive the expected total payoff function per one trade cycle of the strategy. The optimal values are obtained by maximizing the expected total payoff function per trade cycle. The stocks in Technology Hardware, Storage & Peripherals sector are selected in our study. The backtesting results of our strategy are compared with a benchmark model. The empirical results show that our strategy gains more cumulative return than the benchmark in total testing period from 2004 to 2019. However, the number of trades during the testing period is quite small so the robustness of the higher performance is not clear. Our analysis suggests that the entry, exit, and stop-loss levels are increasing in the volatility of the spread, and are decreasing in the speed of reversion of the spread, and the cost of holding short positions.
|